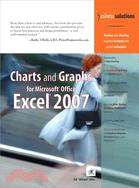
Charts and Graphs for Microsoft Office Excel 2007
商品資訊
ISBN13:9780789736109
出版社:Que Pub
作者:Bill Jelen
出版日:2007/04/05
裝訂/頁數:平裝/461頁
規格:23.5cm*17.8cm*2.5cm (高/寬/厚)
版次:1
商品簡介
“More than a how-to and reference, this book also provides the why-tos and when-tos, with serious consideration given to layout best practices and design possibilities–a very well-rounded resource.”
–Kathy Villella, CEO, PowerFrameworks.com
- Implementing 1-Click Charting
- Incorporating Drag & Drop and Dynamic Charts
- Creating Amazing Effects
- Using Charting Templates and Macros
- Mastering Glow, Shadow, Sparklines, Dashboards, and More
- Eliminating Chart Junk
- Structuring Spreadsheets with Business Diagrams, SmartArt Graphics, and Pivot Charts
- Develop your Charting expertise instantly with proven techniques
After 15 years with no updates to the Excel charting engine, Microsoft has provided a complete rewrite of the chart rendering engine in Excel 2007. However, no amount of soft glow or glass bevel effects will help you communicate your point if you use the wrong chart type. This book helps you choose the right charting type and shows you how to make it look great.
This book shows you how to coax Excel to create many charts you might not have believed were possible. You’ll learn techniques that allow you to ditch the Microsoft defaults and actually create charts that communicate your point. You’ll learn why the Excel stock charts are so restrictive and how you can easily turn any line chart into a stock chart–without any limitations. You’ll also learn how to add invisible series to make columns float in midair. Learn how to create charts right in Excel cells using the new Excel 2007 data bars–or even the decades-old REPT function!
In no time, this book will have you creating charts that wow your audience and effectively communicate your message.
- Master effective visual display of data
- Choose the right chart type to convey your message
- Learn time-saving workarounds
- Create charts that most people think you can’t create with Excel
- Understand what a Radar chart is and when you might use it
- Summarize a million rows of data in a single pivot table chart
- Present data graphically without charts
- Employ SmartArt graphics to show process or relationship charts
-
作者簡介
Bill Jelen is MrExcel! He is principal behind the leading Excel website, MrExcel.com. He honed his Excel wizardry during his 12-year tenure as a financial analyst for a fastgrowing public computer firm. Armed with only a spreadsheet, he learned how to turn thousands of rows of transactional data into meaningful summaries in record time. He is an accomplished author of books on Excel and is a regular guest on The Lab on TechTV Canada. You can find Bill at your local accounting group chapter meeting entertaining audiences with his humorous and informative Power Excel seminar. His website hosts more than 12 million page views annually.
主題書展
更多書展今日66折
您曾經瀏覽過的商品
購物須知
外文書商品之書封,為出版社提供之樣本。實際出貨商品,以出版社所提供之現有版本為主。部份書籍,因出版社供應狀況特殊,匯率將依實際狀況做調整。
無庫存之商品,在您完成訂單程序之後,將以空運的方式為你下單調貨。為了縮短等待的時間,建議您將外文書與其他商品分開下單,以獲得最快的取貨速度,平均調貨時間為1~2個月。
為了保護您的權益,「三民網路書店」提供會員七日商品鑑賞期(收到商品為起始日)。
若要辦理退貨,請在商品鑑賞期內寄回,且商品必須是全新狀態與完整包裝(商品、附件、發票、隨貨贈品等)否則恕不接受退貨。
(到貨天數約30-45天)


