

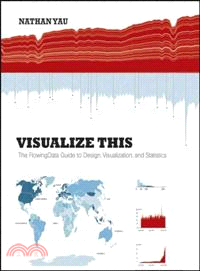
Visualize This: The Flowingdata Guide To Design, Visualization, And Statistics
商品資訊
ISBN13:9780470944882
出版社:John Wiley & Sons Inc
作者:Yau
出版日:2011/06/30
裝訂/頁數:平裝/384頁
規格:23.5cm*18.4cm*2.5cm (高/寬/厚)
商品簡介
Data doesn t decrease; it is ever-increasing and can be overwhelming to organize in a way that makes sense to its intended audience. Wouldn t it be wonderful if we could actually visualize data in such a way that we could maximize its potential and tell a story in a clear, concise manner? Thanks to the creative genius of Nathan Yau, we can. With this full-color book, data visualization guru and author Nathan Yau uses step-by-step tutorials to show you how to visualize and tell stories with data. He explains how to gather, parse, and format data and then design high quality graphics that help you explore and present patterns, outliers, and relationships.
- Presents a unique approach to visualizing and telling stories with data, from a data visualization expert and the creator of flowingdata.com, Nathan Yau
- Offers step-by-step tutorials and practical design tips for creating statistical graphics, geographical maps, and information design to find meaning in the numbers
- Details tools that can be used to visualize data-native graphics for the Web, such as ActionScript, Flash libraries, PHP, and JavaScript and tools to design graphics for print, such as R and Illustrator
- Contains numerous examples and descriptions of patterns and outliers and explains how to show them
Visualize This demonstrates how to explain data visually so that you can present your information in a way that is easy to understand and appealing.
作者簡介


今日66折


您曾經瀏覽過的商品

購物須知
外文書商品之書封,為出版社提供之樣本。實際出貨商品,以出版社所提供之現有版本為主。部份書籍,因出版社供應狀況特殊,匯率將依實際狀況做調整。
無庫存之商品,在您完成訂單程序之後,將以空運的方式為你下單調貨。為了縮短等待的時間,建議您將外文書與其他商品分開下單,以獲得最快的取貨速度,平均調貨時間為1~2個月。
為了保護您的權益,「三民網路書店」提供會員七日商品鑑賞期(收到商品為起始日)。
若要辦理退貨,請在商品鑑賞期內寄回,且商品必須是全新狀態與完整包裝(商品、附件、發票、隨貨贈品等)否則恕不接受退貨。