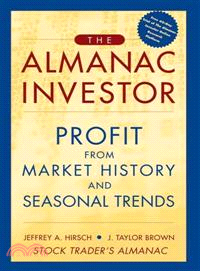
The Almanac Investor: Profit from Market History Seasonal Trends
商品資訊
ISBN13:9780471654056
出版社:John Wiley & Sons Inc
作者:Jeffrey A. Hirsch; J. Taylor Brown
出版日:2005/10/19
裝訂/頁數:平裝/525頁
商品簡介
- Trusted advice and techniques that can improve any reader's overall trading efficiency.
- Contains data, indicators, and patterns needed to understand how and why the stock market fluctuates.
- A companion Web site will host a revolutionary Web-based system to evaluate and improve trading practices.
- Includes a step-by-step tutorial, which supplements every study in the book.
作者簡介
J. TAYLOR BROWN is Vice President of the Hirsch Organization.
目次
Part 1: Indicators and Patterns.
January Indicators and Patterns.
January Almanac.
Typical January.
January’s First Five Days “Early Warning System”.
The Incredible January Barometer.
1933 “Lame Duck” Amendment — Why JB Works.
New Congress Barometers.
JB versus All.
Down Januarys Followed by Further Declines.
The So-Called “January Effect”.
February Indicators and Patterns.
February Almanac.
Typical February.
Market Negative Before & After Presidents’ Day.
March Indicators and Patterns.
March Almanac.
Typical March.
Luck of the Irish Hits Wall Street Day Before St. Pat’s.
April Indicators and Patterns.
April Almanac.
Typical April.
Good Friday Better in April.
Down January + Down April = Bad Sign.
May Indicators and Patterns.
May Almanac.
Typical May.
Wall Street Rallies For Moms.
Memorial Day and the Stock Market.
June Indicators and Patterns.
June Almanac.
Typical June.
NASDAQ’s Powerful 12-Day Mid-Year Rally.
July Indicators and Patterns.
July Almanac.
Typical July.
Hot July Markets Often Precede Fourth Quarter Buying Opportunities.
August Indicators and Patterns.
August Almanac.
Typical August.
September Indicators and Patterns.
September Almanac.
Typical September.
Trading the Labor Day Market.
October Indicators and Patterns.
October Almanac.
Buy! Buy! Buy!
Typical October.
November Indicators and Patterns.
November Almanac.
Typical November.
Trading the Thanksgiving Market.
December Indicators and Patterns.
December Almanac.
Typical December.
Most of the So-Called “January Effect” Starts in Mid-December.
The Only “Free Lunch” on Wall Street.
Santa Claus Rally.
Half-Hourly Trading Patterns.
Weekly Trading Patterns.
Dow Gains Most First Two Days of the Week.
Monday Now Most Profitable S&P 500 Day of the Week.
S&P 500 Daily Performance Each Year Since 1952.
NASDAQ Strongest Last Three Days of the Week.
NASDAQ Daily Performance Each Year Since 1971.
Monthly Trading Patterns.
Typical S&P Month
Typical NASDAQ Month
Dow Gains More Eight Days a Month Than On
All 13 Remaining Days Combined
S&P 500 Market Probability Calendars
Dow Jones Industrials Market Probability Calendars
NASDAQ Market Probability Calendars
Russell 1000 Market Probability Calendars
Russell 2000 Market Probability Calendars
Annual Trading Patterns.
Market Behavior Three Days Before and Three Days After Holidays.
Seasonal Rallies and Corrections.
Best Months of the Year: Seasonal Switching Strategies.
Aura of the Triple Witch: Fourth Quarter Most Bullish, Down Weeks Trigger More Weakness Week After.
Annual Trading Volume Patterns.
The December Low Indicator: A Use Prognosticating Tool.
The Four-Year Presidential Election/ Stock Market Cycle.
The 172-Year Saga Continues.
How the Government Manipulates the Economy to Stay in Power.
Gridlock on Capitol Hill Is Best for the Markets.
Post-Election Years: Paying the Piper.
Under Democrats $10,000 Grows to $279,705, but Only to $80,466 Under Republicans.
Market Behavior When Incumbent Party Wins and Loses.
Post-Election High to Midterm Low: –22.2%.
Midterm Election Years: Where Bottom Pickers Find Paradise.
50% Gain From Midterm Low to Pre-Election High.
Prosperity More Than Peace Determines Outcome of Midterm Congressional Races.
Midterm Election Time Unusually Bullish.
Pre-Election Years: No Losers Since 1939
Only One Loss Last 7 Months of Election Years.
Incumbent Victories versus Incumbent Defeats.
Market Acts as a Barometer Between the Last Convention and Election Day.
Election Year Perspectives and Observations.
Decennial Cycle: A Market Phenomenon.
Bull and Bear Markets Since 1900.
How War and Peace Impact the Markets.
The Three Peaks and Domed House Recurring Market Pattern.
Part 2: Seasonal Sector Investing.
Sector Indices.
Exchange Traded Funds (ETFs).
Part 3: Databank.
Dow Jones Industrial Average Since 1950.
Standard & Poor’s 500 Since 1950.
NASDAQ Since 1971.
Russell 1000 Since 1979.
Russell 2000 Since 1979.
主題書展
更多書展今日66折
您曾經瀏覽過的商品
購物須知
外文書商品之書封,為出版社提供之樣本。實際出貨商品,以出版社所提供之現有版本為主。部份書籍,因出版社供應狀況特殊,匯率將依實際狀況做調整。
無庫存之商品,在您完成訂單程序之後,將以空運的方式為你下單調貨。為了縮短等待的時間,建議您將外文書與其他商品分開下單,以獲得最快的取貨速度,平均調貨時間為1~2個月。
為了保護您的權益,「三民網路書店」提供會員七日商品鑑賞期(收到商品為起始日)。
若要辦理退貨,請在商品鑑賞期內寄回,且商品必須是全新狀態與完整包裝(商品、附件、發票、隨貨贈品等)否則恕不接受退貨。


